What is Supply Curve in Microeconomics?
Understand the supply curve in microeconomics, its significance, and how it affects market supply and pricing decisions.
Introduction to the Supply Curve
In microeconomics, the supply curve is a fundamental concept that shows the relationship between the price of a good and the quantity producers are willing to supply. Understanding this curve helps you grasp how markets function and how prices are determined.
We will explore what the supply curve represents, its shape, and the factors that influence it. This knowledge empowers you to analyze market behavior and make informed economic decisions.
What is a Supply Curve?
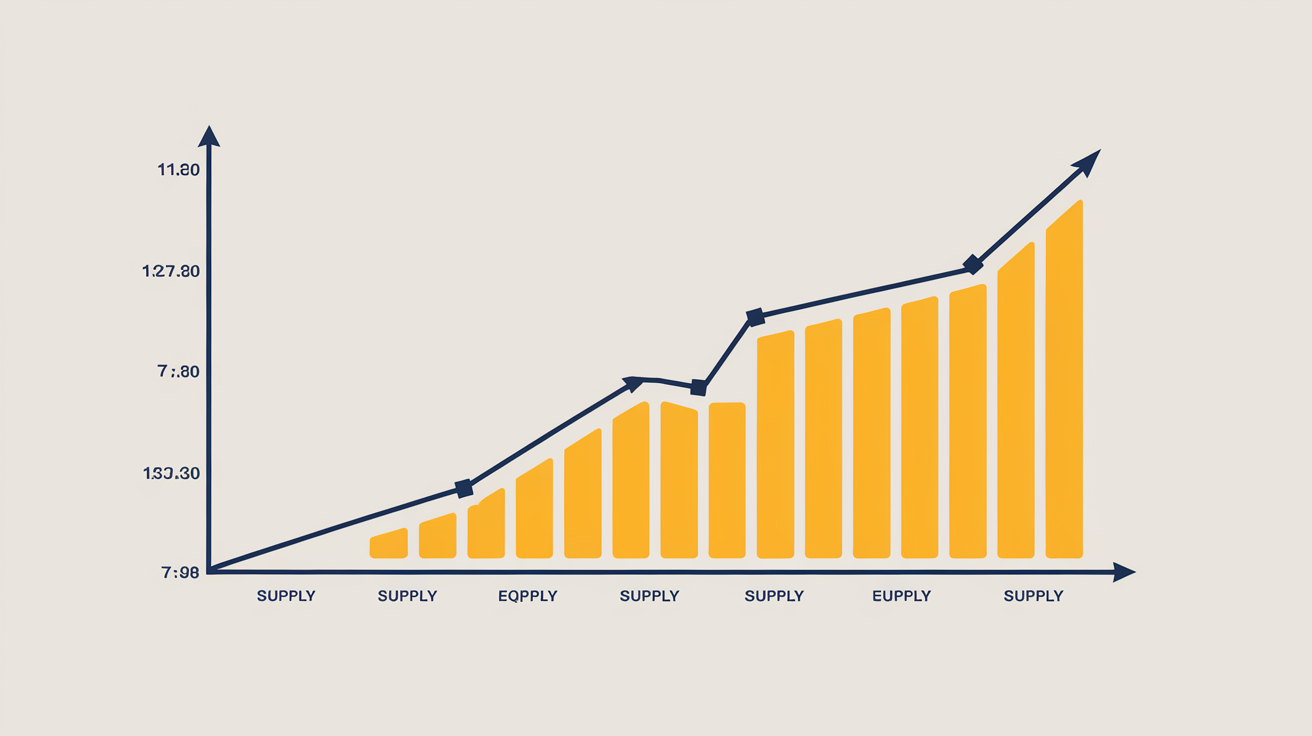
The supply curve is a graphical representation showing how much of a product suppliers are willing to offer at different prices. It typically slopes upward, indicating that higher prices motivate producers to supply more.
It plots price on the vertical axis and quantity supplied on the horizontal axis.
Each point on the curve reflects the quantity supplied at a specific price.
The upward slope reflects the law of supply: as price rises, quantity supplied increases.
Why Does the Supply Curve Slope Upward?
The supply curve slopes upward because higher prices make production more profitable. When prices rise, producers are encouraged to increase output to maximize profits.
Higher prices cover higher production costs for additional units.
Producers may invest in more resources or technology to increase supply.
At lower prices, some producers may not find it worthwhile to supply the product.
Factors That Shift the Supply Curve
The supply curve can shift due to changes in factors other than price. These shifts represent changes in supply at every price level.
- Input Prices:
A rise in costs like labor or materials shifts supply left (decreases supply).
- Technology:
Improvements make production cheaper, shifting supply right (increasing supply).
- Number of Sellers:
More sellers increase supply, shifting the curve right.
- Government Policies:
Taxes can reduce supply; subsidies can increase it.
- Expectations:
If producers expect higher future prices, current supply may decrease.
Difference Between Movement Along and Shift of Supply Curve
It's important to distinguish between a movement along the supply curve and a shift of the supply curve.
- Movement Along:
Caused by a change in the product's price, leading to a different quantity supplied.
- Shift:
Caused by changes in other factors like input costs or technology, changing supply at all prices.
Real-World Example of a Supply Curve
Consider a farmer selling apples. If the price per apple rises from $1 to $2, the farmer is willing to supply more apples because the higher price covers extra labor and resources.
At $1, the farmer supplies 100 apples.
At $2, the farmer supplies 200 apples.
This increase in quantity supplied with price rise forms the upward-sloping supply curve.
How the Supply Curve Helps in Market Analysis
The supply curve is essential for understanding market equilibrium, where supply meets demand. It helps you predict how changes in price or external factors affect market supply.
Analyzing supply shifts helps forecast price changes.
It aids businesses in planning production levels.
Policymakers use it to assess impacts of taxes or subsidies.
Conclusion
The supply curve is a key tool in microeconomics that illustrates how producers respond to price changes. Its upward slope reflects the law of supply, showing that higher prices encourage more production.
By understanding what shifts the supply curve and how it interacts with demand, you can better analyze market dynamics and make smarter economic decisions.
What is the supply curve in simple terms?
The supply curve shows how much of a product producers will supply at different prices, usually increasing as prices rise.
Why does the supply curve slope upward?
Because higher prices make it profitable for producers to supply more, covering higher production costs.
What causes the supply curve to shift?
Changes in input costs, technology, number of sellers, government policies, or expectations can shift the supply curve.
What is the difference between movement along and shift of supply curve?
Movement along the curve is due to price changes; shifts happen when other factors affecting supply change.
How does the supply curve affect market prices?
The supply curve helps determine market prices by showing how much producers will supply at various prices, influencing equilibrium with demand.