What is U-Shaped Recovery?
Understand what a U-shaped recovery is, how it impacts economies, and key differences from other recovery types in financial markets.
Introduction
When economies face downturns, the way they bounce back can vary widely. You might have heard terms like V-shaped or U-shaped recovery tossed around. But what exactly is a U-shaped recovery, and why does it matter to you as an investor or someone interested in economic trends?
In this article, we’ll explore the concept of a U-shaped recovery, explain how it differs from other recovery patterns, and discuss what it means for markets and your financial decisions.
What is a U-Shaped Recovery?
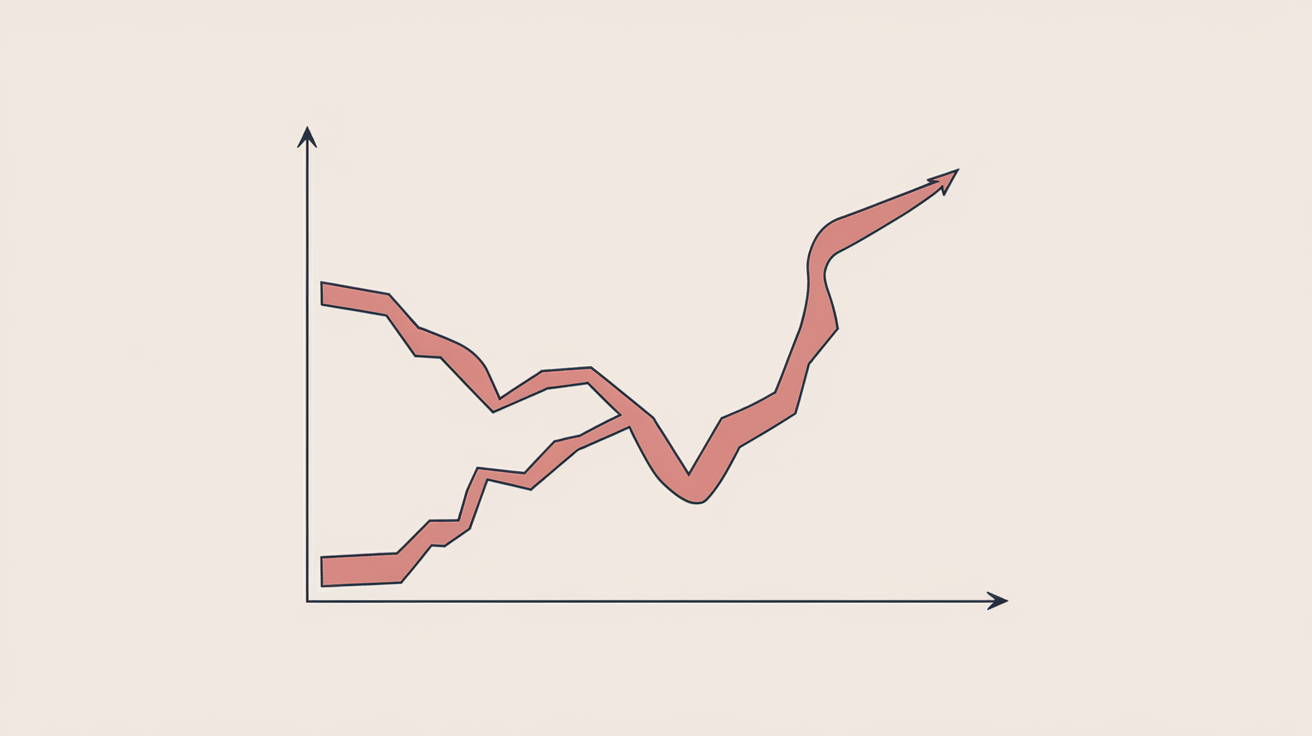
A U-shaped recovery describes an economic recession followed by a prolonged period of stagnation before the economy finally returns to its previous growth trend. Unlike a quick rebound, the economy stays flat or grows very slowly for some time, forming a "U" shape when charted.
This pattern indicates that after a downturn, the economy doesn’t bounce back immediately. Instead, it experiences a slow and steady recovery phase before regaining momentum.
Key Characteristics of U-Shaped Recovery
Extended period of low or no growth following a recession.
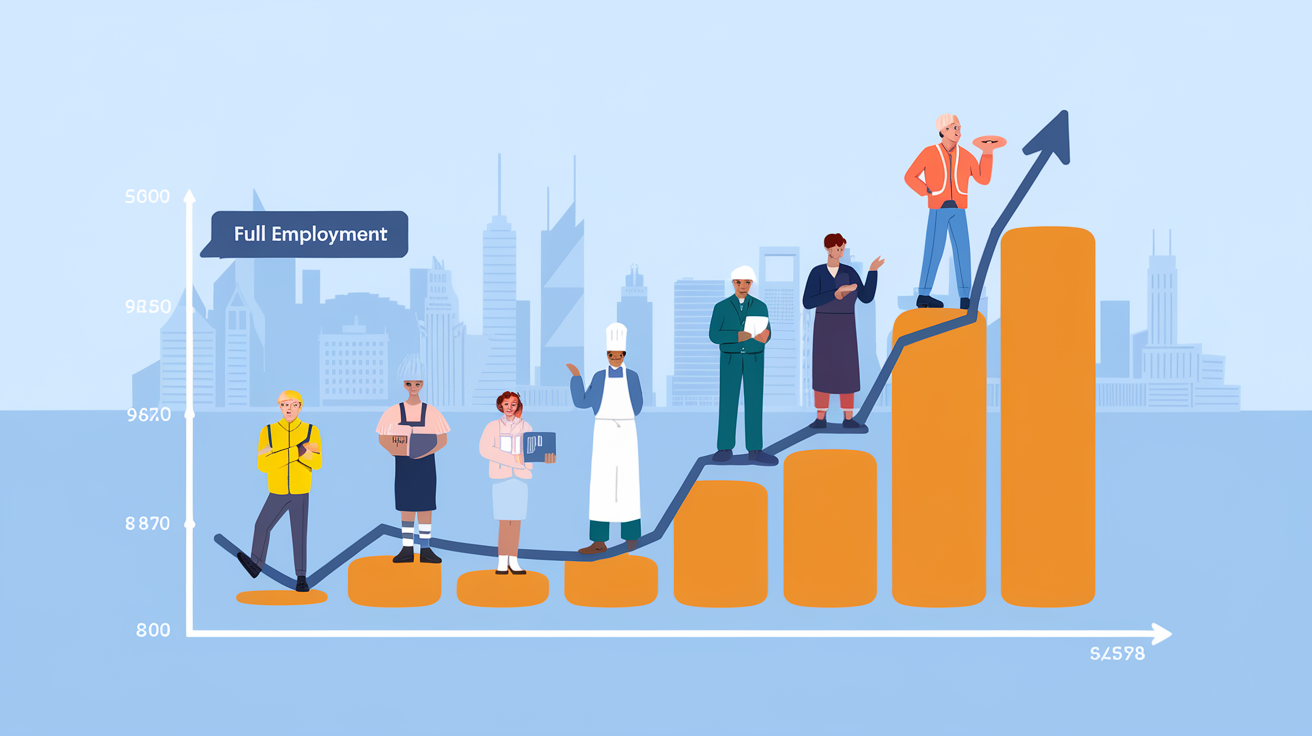
Gradual improvement in economic indicators like GDP, employment, and consumer spending.
Recovery phase can last several quarters or even years.
Often involves structural adjustments in industries or markets.
How Does U-Shaped Recovery Differ from Other Recovery Types?
Understanding the differences between recovery shapes helps you anticipate market behavior and plan your investments accordingly.
V-Shaped Recovery
This is the fastest type of recovery where the economy sharply declines but quickly rebounds to its previous peak. The graph looks like a “V.” It’s often driven by strong policy responses or pent-up demand.
W-Shaped Recovery
Also called a double-dip recession, this pattern shows a recovery followed by another downturn before finally improving. It looks like a “W” on the chart.
L-Shaped Recovery
This is the slowest and most severe recovery, where the economy falls and then remains stagnant or grows very little for a long time. The graph resembles an “L.”
U-Shaped Recovery
The U-shaped recovery sits between the quick V and the prolonged L. It reflects a moderate pace of recovery after a recession, with a noticeable but slow return to growth.
Causes of a U-Shaped Recovery
Several factors can lead to a U-shaped recovery, including:
- Structural economic changes:
Industries may need time to adjust to new technologies or regulations.
- Weak consumer confidence:
People may delay spending, slowing economic growth.
- Policy delays:
Government or central bank interventions might take time to impact the economy.
- Global economic conditions:
External shocks or slow global demand can prolong recovery.
Examples of U-Shaped Recoveries
History provides examples where economies experienced U-shaped recoveries:
- Early 1990s US recession:
The US economy took over a year to recover after a mild recession, showing a U-shaped pattern.
- Japan’s Lost Decade:
Japan’s economy struggled with slow growth for years after the early 1990s asset bubble burst.
Implications for Investors and Businesses
Knowing a U-shaped recovery is underway can help you make better financial decisions:
- Investment patience:
Expect slower returns and avoid panic selling during the flat phase.
- Diversify portfolios:
Include defensive stocks and sectors less sensitive to economic cycles.
- Monitor policy changes:
Central bank moves can signal when recovery may accelerate.
- Business planning:
Companies should prepare for gradual demand increases and avoid overexpansion.
How to Identify a U-Shaped Recovery Early
Spotting a U-shaped recovery early can be challenging but valuable:
Watch economic indicators like GDP growth rates, unemployment trends, and consumer spending.
Look for a prolonged period of low or flat growth after a recession.
Follow central bank policies and fiscal stimulus announcements.
Pay attention to industry-specific data to see if sectors are adjusting.
Conclusion
A U-shaped recovery means the economy takes its time to bounce back after a downturn. It’s slower than a V-shaped recovery but better than an L-shaped stagnation. Understanding this pattern helps you set realistic expectations and plan your investments wisely.
By recognizing the signs and causes of a U-shaped recovery, you can navigate economic cycles more confidently and make smarter financial choices during uncertain times.
FAQs
What does a U-shaped recovery mean for the stock market?
It usually means slower gains and more volatility, as investors wait for clear signs of economic improvement before pushing prices higher.
How long does a U-shaped recovery typically last?
It can last several quarters to a few years, depending on the severity of the recession and the effectiveness of policy responses.
Can a U-shaped recovery turn into a V-shaped recovery?
It’s rare but possible if strong economic stimuli quickly boost growth after the stagnation phase.
Which sectors perform well during a U-shaped recovery?
Defensive sectors like healthcare, utilities, and consumer staples tend to be more stable during slow recoveries.
How should I adjust my investments during a U-shaped recovery?
Focus on diversification, maintain a long-term view, and avoid panic selling during slow growth periods.